Lab 03 - LIDAR: Cones classification
Robotics II
Poznan University of Technology, Institute of Robotics and Machine Intelligence
![]()
Laboratory 3: Cones classification using LIDAR sensor intensity data
Back to the course table of contents
1. Intensity data
Intensity is a value connected with the laser distance measurement. It describes the strength of returning laser pulse for every measured point. Value of intensity varies for different types of objects, surfaces and colors. Moreover the measurement can also be affected by object roughness, moisture content, range or scan angle. Intensity data can be used in lidar point classification.
Formula Student Driverless track marking
Formula Student track for Driverless competitions purpose is marked with 4 types of cones:
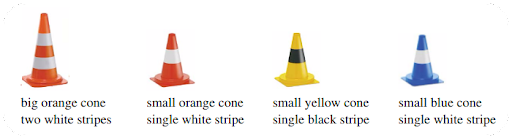
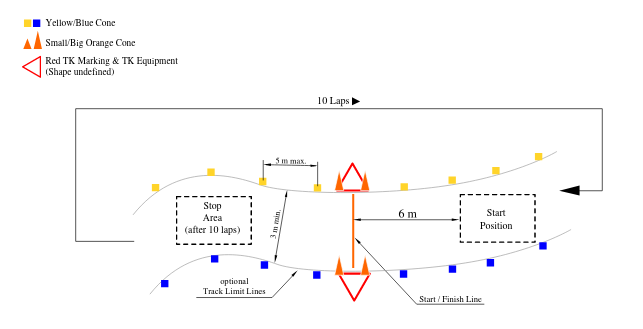
Positions and function of every used cone class is as follow: - big orange - start / stop line - small orange - brake area for Acceleration and Skid Pad competitions - small yellow - right side of the track - small blue - left side of the track
Assumptions are illustrated by figure below:
Cones in LIDAR view
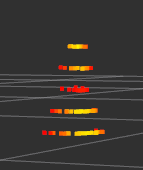
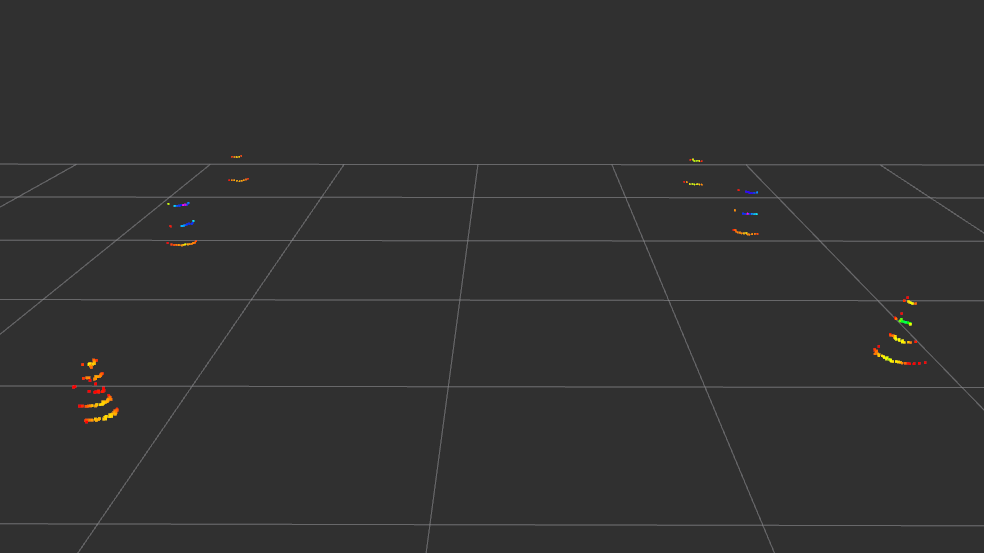
Figures below show accordingly yellow cone, blue cone and the Trackdrive in view of PointCloud2 message from laser scanner.

2. Dataset
The dataset used in this task comes from the UGRacing (Formula Student AI)project and contains data from a real-world autonomous race car navigating a track marked by cones. It includes several interrelated data sources: raw point clouds from a LiDAR sensor (saved as . pcd files), detections of potential cones in the vehicle’s local frame (lidar_cones.csv), a detailed reference map with the positions and colors of the cones marked (labelled_cones.csv), and odometric data describing the vehicle’s motion and orientation over time (odometry.csv). By combining these elements, it is possible to transform observations from the local to the global coordinate system, align them with real-world objects, and perform further analysis. The dataset is realistic—it contains measurement noise, detection imperfections, and imperfect alignments—which accurately reflects real-world challenges in mobile robotics. Its main goal in the context of this lab is not object detection itself, but their classification (e.g., by color) based on spatial data, which allows students to practice the full pipeline of sensor data processing and machine learning in a practical application.
3. Tasks
Part I
Make a copy of Google Colab interactive tutorial to your Google Drive. Follow the instructions in the notebook.
Part II
We will use node, which is already implemented in previous labs, a cone detection node based on LiDAR data. Its tasks include:
- subscribing to the PointCloud2 point cloud,
- preliminary data filtering,
- grouping points belonging to potential traffic cones,
- publishing detected candidates, e.g., as a PoseArray.
The next step is to write a new ROS 2 node whose task will be to classify the detected candidates. This node should operate independently of the detector but use its results.
How this node should work:
Node Inputs
The classification node should subscribe to two data sources: - a LiDAR point cloud (PointCloud2) – full measurement data, - candidate cones (PoseArray) – the output of the detection node.
Step 1: Cropping the ROI (Region of Interest)
For each detected candidate:
- Take its position (x, y)
- Crop a local section of the point cloud around that position
Step 2 – Feature Extraction
For each point within the ROI, we calculate a feature vector, e.g.:
- number of points
- average position (x, y, z)
- standard deviation
VERY IMPORTANT:
- the number of attributes must be the same (e.g., 15)
- the order must be identical
- the definitions must be identical … like in .onnx model
Step 3 – Model Classification
We pass the calculated feature vector to the model:
features → ONNX model → class predictionStep 4 – Publishing the Result
After classification, the node should publish the result in a convenient format.
Possible options:
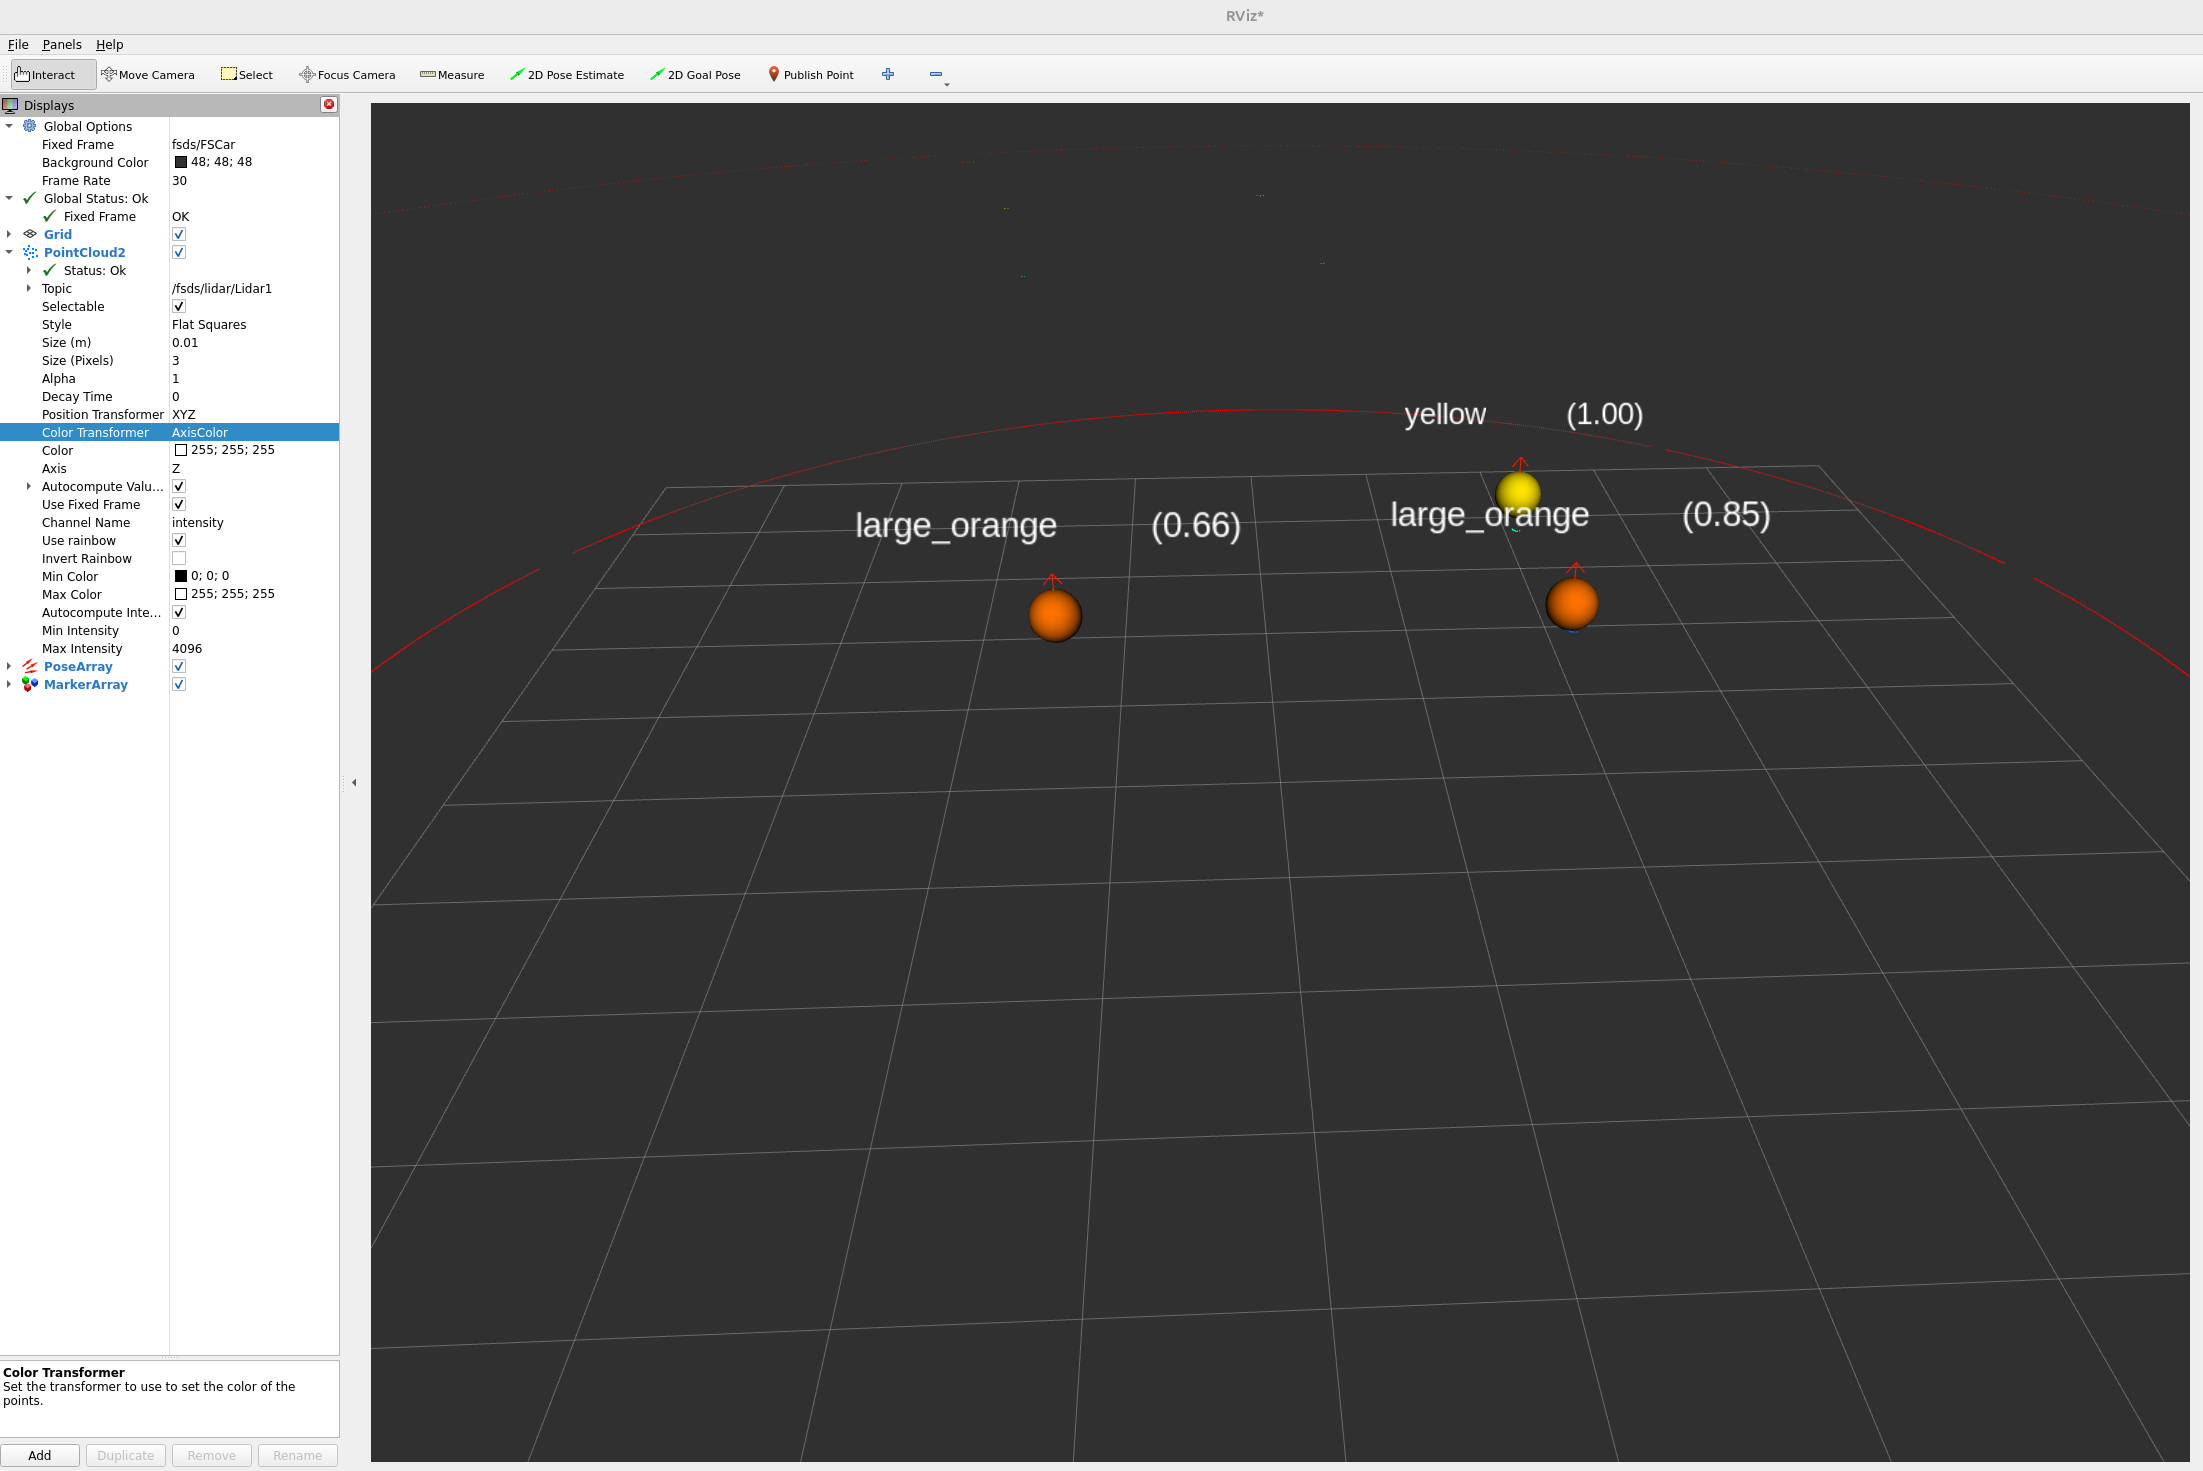
- Visualization (RViz) with MarkerArray
- color = cone class
- text = class name
- Data for further use
- PoseArray
- eventually a custom message type, e.g.:
Final pipeline
PointCloud2 (LiDAR)
        ↓
candidate detection
        ↓
PoseArray (cones' positions)
        ↓
ROI cropping
        ↓
feature extraction
        ↓
ONNX model
        ↓
cone classification
        ↓
result publication
To do task
Add to the eKursy platform
- your_file.txt with answers to questions in colab file,
- exported classification model data in ONNX format
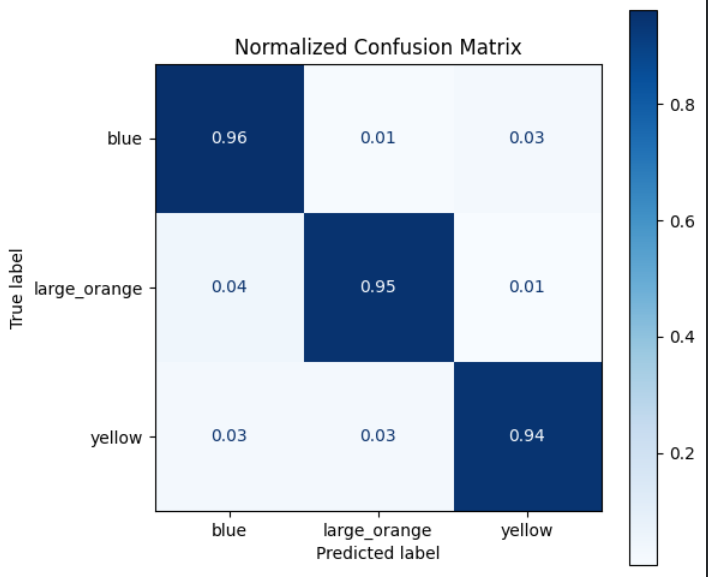
- confusion_matrix which refer to classification results of model
- screenshot of Rviz2 viewer with added for example MarkerArray message published by your node,
- your python script with implementation of your node.